

The yield curve in the Copy Trading service is plotted based on the time-weighted rate of return (TWR). The TWR method breaks the account’s trading history into separate intervals based on balance transactions, i.e., whether money was added or withdrawn from the account. The return is calculated for each interval that had no balance transactions (no cash flow changes). The total profitability of the account is calculated as the product of the yield of all intervals.
The formula for calculating yield:
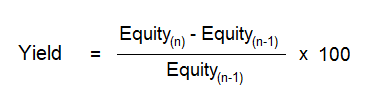
where:
Equity(n) – Funds at the end of the period (before replenishment)
Equity(n-1) – Funds at the beginning of the period (before replenishment)
The return of an Investment account may differ from the Strategy’s return because multiple Strategies with varying profitability can be alternately copied to one Investment account. Similarly, one Strategy may be copied at different time intervals, contributing to variations in the return value.