Article content
Many professional traders and millionaires such as George Soros, Andrew Krieger, Bill Lipschutz, who made their fortune trading euros, dollars and yen agree that novice traders should start their journey with the foreign exchange market.
But do not rush to count your profit. The unspoken rule of life says:
“To get what you want, you first have to give something.”
Simply put, life loves investment. So does trading.
Therefore, your first investment on the way to those coveted dollars is to go through this article.
Now, let’s get started.
Why Everyone Loves Forex
People have 3 quite logical reasons for this:
The largest and the richest market
Every day around 5 trillion dollars are circulating in this market. Can you even imagine this number?
$5,000,000,000,000
Traders and financial institutions from all over the world participate in the foreign exchange market, the cash flow is enormous:
- Wall Street bankers
- Central banks (including your national central bank)
- Large institutional investors and retail traders with more than one million dollars in their accounts
All of them act as buyers and sellers in the currency market. And everyone has their own goals:
What do banks want?
The bank came here to exchange 100 thousand dollars for euros for its client. The bank will receive a reward for its work: the client will pay commission for exchanging one currency for another.
What does a client want?
The client wants to start a business in Europe and asks the bank to sell dollars and buy euros for him.
The client dreams of moving to a new country with a nice climate. He wants to get a new car when the business is running and things go up.
What’s in it for a trader?
A trader looks at this and thinks:
“Starting a business in Europe is becoming a trend. In a month, there will be 3 times more people like client X. The demand for the euro will rise. I need to go long! (i.e. to buy)”
The trader opens three positions:
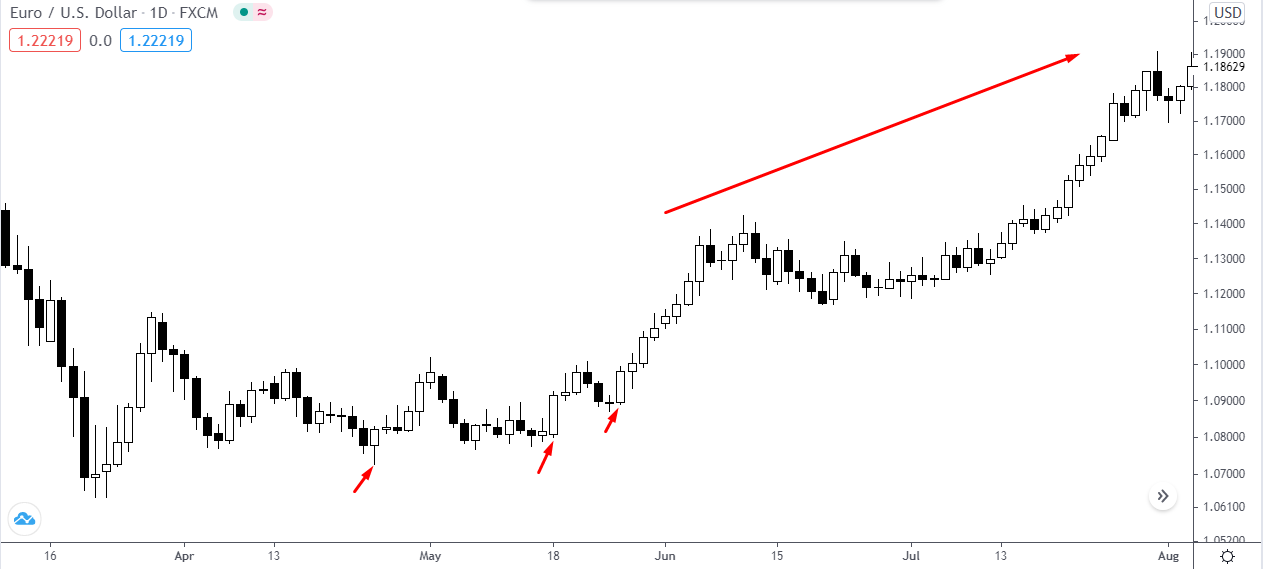
At first, the price is moving in a sideways range and the market is flat. But the trader has everything figured out – he has a strategy. He is waiting for his “finest hour” and … the euro price chart goes up: The forecast was correct, and the trader earns money.
We came up with a terrific example, huh?
But it’s not just about the money. We have 2 more reasons why everyone likes Forex so much:
Forex trading is available 24/5
It means that you can trade around the clock, be it 4 am in the morning or 5 pm in the evening.
As many as 26 currency pairs are at your disposal, available for trading. Later we will share which currency pair is best for a start.
The foreign exchange market is the most liquid market
The last and very significant reason. Massive money flows and liquidity allows you to buy and sell currencies at any time. You just need to specify the desired volume of your position in the trading platform and click the “buy” or “sell” button depending on your forecast for the price.
Thanks to this high market liquidity, chart patterns work pretty well. But we’ll get back to this later.
Now, let us take you back to Belgium, to the 16th century. At that time, pirates were a real thing. People could see them not only on their TV screens.
A Bit of Trading History
There is no exact date, but they say that trading as we know it was born in the 16th century in Belgium, in the city named Antwerp.
At that time, gold, silver and goods were actively traded. According to historians, in 1531, the first stock exchange was opened in Antwerp, where goods, government bonds and stocks were traded.
By the way, Antwerp is still the second largest and most important port in Europe:
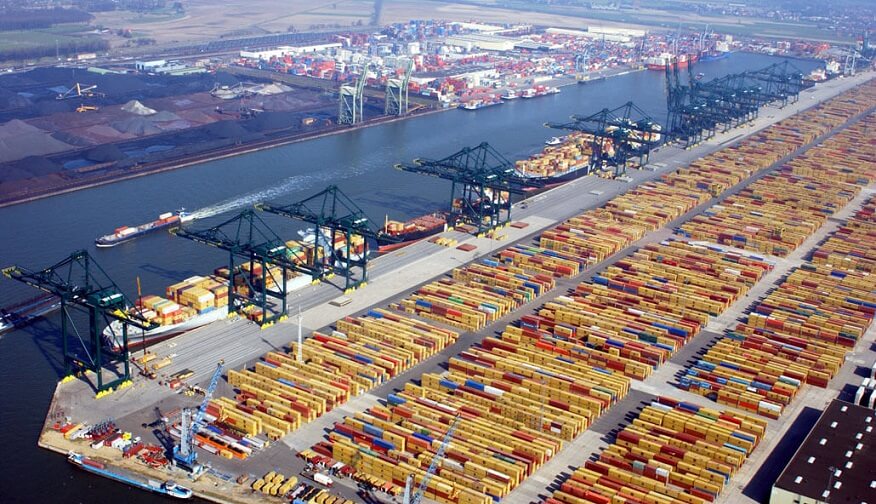
Antwerp, Belgium
Trading in Japan
Other historians suggest that stock trading was born in Japan in the 18th century when a local rice merchant Homma Munehisa began handing out rice bale futures right and left.
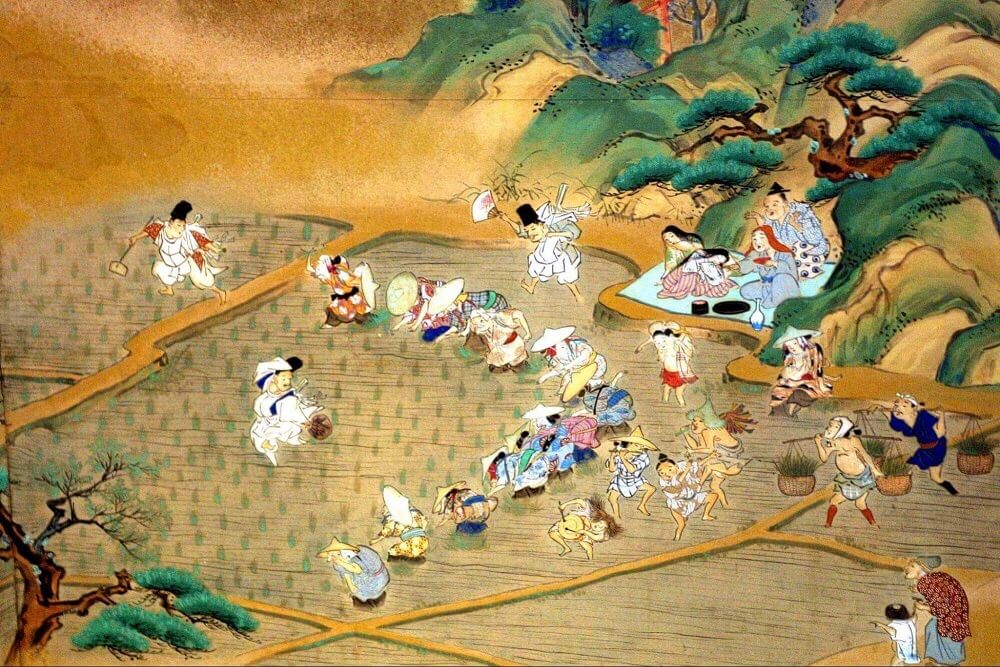
Homma is probably the one chilling on a picnic blanket
Homma was a top-notch trader:
- He drew trading charts based on various time intervals (time frames) when no one had heard of it.
- He analyzed rice prices and learned to make better trades from the previous experience of other traders.
Homma did not rely on just one merchant: he worked with various vendors from all walks of life. This is how traders diversified their risks in the 18th century.
Later Munehisa came up with Japanese candles. But we’ll talk about them a bit later.
The next stage of trading history falls in the 20th century – the rise of Wall Street. Everyone remembers the movie “The Wolf of Wall Street”, where dishonest brokers made money on gullible investors.
But life goes on: no one calls brokers to open a trade anymore. Today, everyone uses electronic trading networks and ECN accounts.
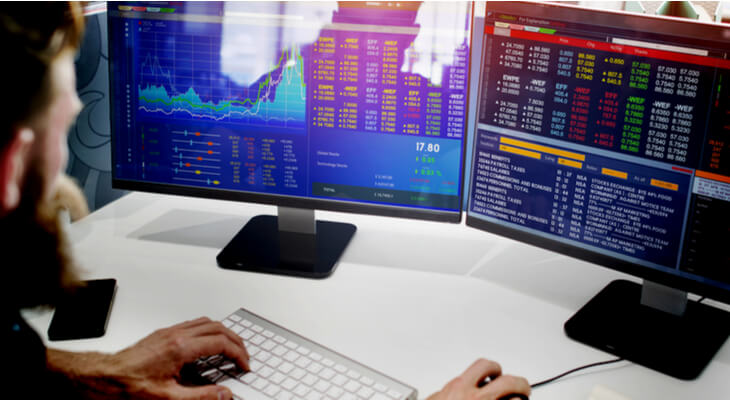
Trading has now become computerized
To get started, you only need to:
- Open a trading account with a broker
- Make a minimum deposit (usually $100 is enough)
- Learn to read price charts
And, of course, to have a strong desire to learn.
You’re still reading – and that’s great. We are now moving on to our next chapter:
Essential skills that beginner traders need to make money in the Forex market
Experienced traders identify 3 essential skills that can help novice traders become successful in the financial markets and maybe finally buy a villa by the sea (a car, a new iPhone, you name it – depending on your financial goals here):
- The ability to read trading charts. It is called technical analysis.
- The skill to analyze market news and macroeconomic events or fundamental analysis.
- And last but not least – discipline.
Let’s consider each of these skills separately:
Technical Analysis for Novice Traders
A beginner needs technical analysis to get a fundamental understanding of how the price moves and learn to read price charts and identify chart patterns:
As traders, we are interested in:
- What’s going on now
- How the price moved before
- And what will happen in the future
Technical analysis uses different methods:
- Support and resistance zones
- Trend analysis
- And even Fibonacci numbers used in mathematics
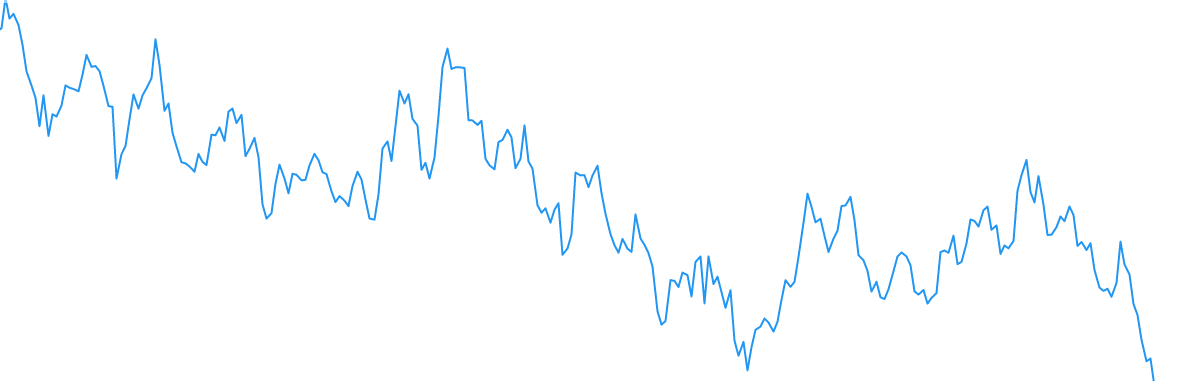
But don’t be alarmed. It’s not as complicated as it may seem. Let’s take a closer look at the chart below:
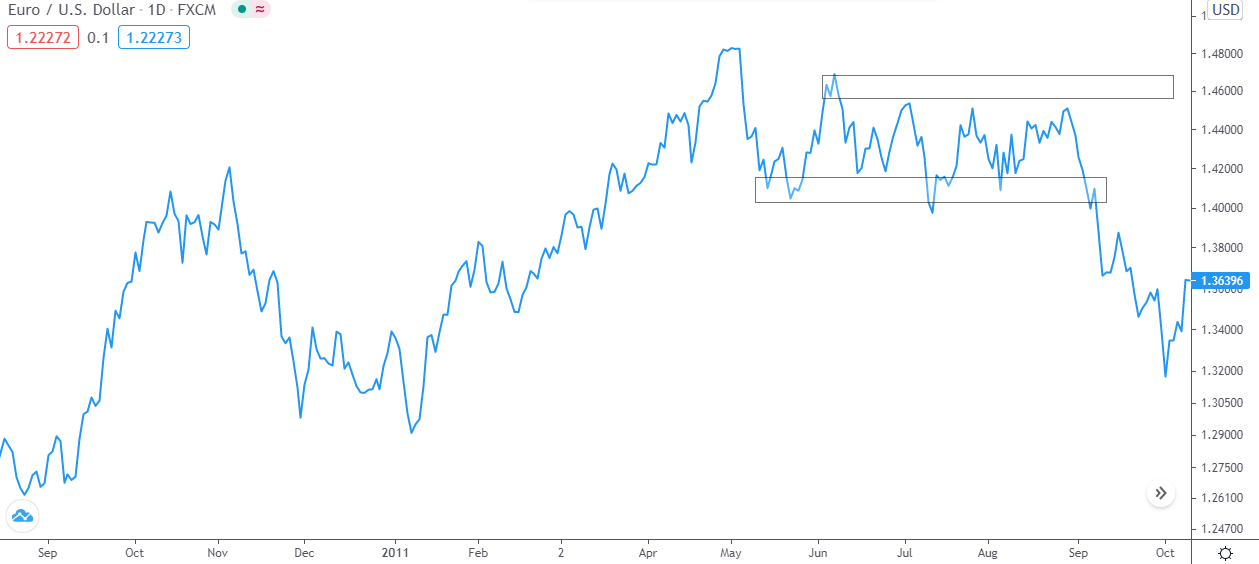
The chart shows EUR/USD – Euro vs. the US dollar. We can see that the price was rising at first, but then it stopped at some point and began to move sideways.
The price met resistance from above, as traders were selling euros. Apparently, they considered it too expensive.
The price then met the support below. Buyers in this zone thought that once the price fell, it would rise soon. And someone bought simply because others did so.
So it turned out that the EUR/USD rate got stuck between the two zones.
See? There’s no mathematics or any scientific wisdom here. And you’ve just performed your first chart analysis!
Japanese candlesticks in technical analysis
Japanese candlesticks are a very important tool in technical analysis. We have decided to devote a mini-chapter to them.
As you may have guessed from the name, candlesticks were invented in Japan. And those who read carefully remember that the very same Homma Munehisa, who traded in rice in 1750-1760, is considered the “father” of the candle candlestick trading charts.
It was then that he came up with the idea of drawing a chart as candlesticks. By the way, Homma did it manually:
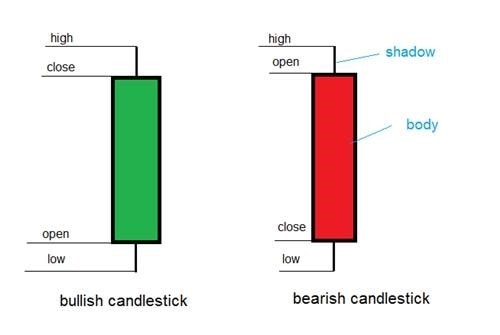
Japanese candlesticks: Bullish candle and Bearish candle
Back in the day, there was no internet, so Homma couldn’t share his invention with the rest of the world. In the late 1980s, Steve Neeson, an American analyst and trader, accidentally learned from a broker that his traders were trying to apply candles in trading – but to no avail.
No one had heard of Japanese candlesticks in America. Neeson was so fascinated that he started to research this subject, and in 1989 he released his bestseller – the famous book “Japanese Candlestick Charting Techniques: A Contemporary Guide to the Ancient Investment Techniques of the Far East”:
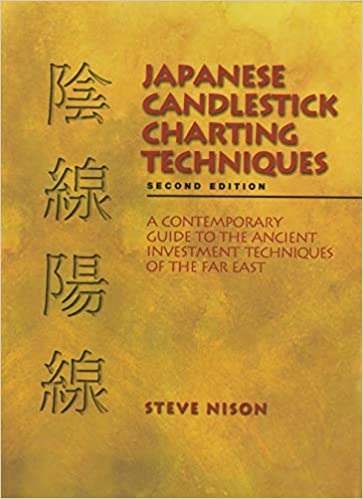
The book revolutionized the entire world of trading and technical analysis. Traders had only used bar charts before.
After Neeson, proponents of candlestick analysis began to spread it around the world. They built up and expanded Neeson’s work until the movement reached its peak in the early 2000s. That’s when the world saw “Price Action” – a new version of technical analysis with Steve Neeson called the ‘Father of Candlesticks’.
Interesting fact: The term “Price Action” was introduced and popularized on the ForexFactory Forum.
Today, we can’t picture a chart without candlesticks on it. Every professional trader knows how to read and trade candlestick patterns.
Each candlestick has shadows: wicks located either below and above the opening price.
The body of the candlestick can be white (ascending) or black (descending). On the chart, you can change the color of the bodies to green and red, which many traders do.
How candlesticks work
Below we have marked a candlestick with a long shadow at the bottom. Note that its upper shadow and body are small. Such a candlestick often becomes a reversal signal since it represents a certain pattern of traders’ behavior:
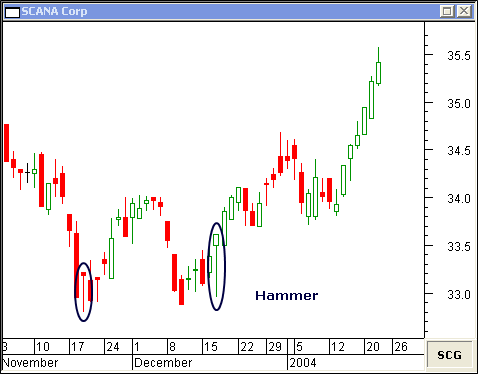
The “Hammer” reversal pattern
This candlestick is called the hammer and it tells us that sellers are exiting the market at low prices. Buyers are taking over, and the price may rise soon. This is what happened in our example.
The probability nature of trading
We have used the word “probable” for a reason. The point is that in trading, there is no guarantee that your signal, idea or strategy will be 100% accurate.
This is the nature of trading: no one knows for sure how the price will behave in a day, a week or a month. And those who say they know are just pretending ?
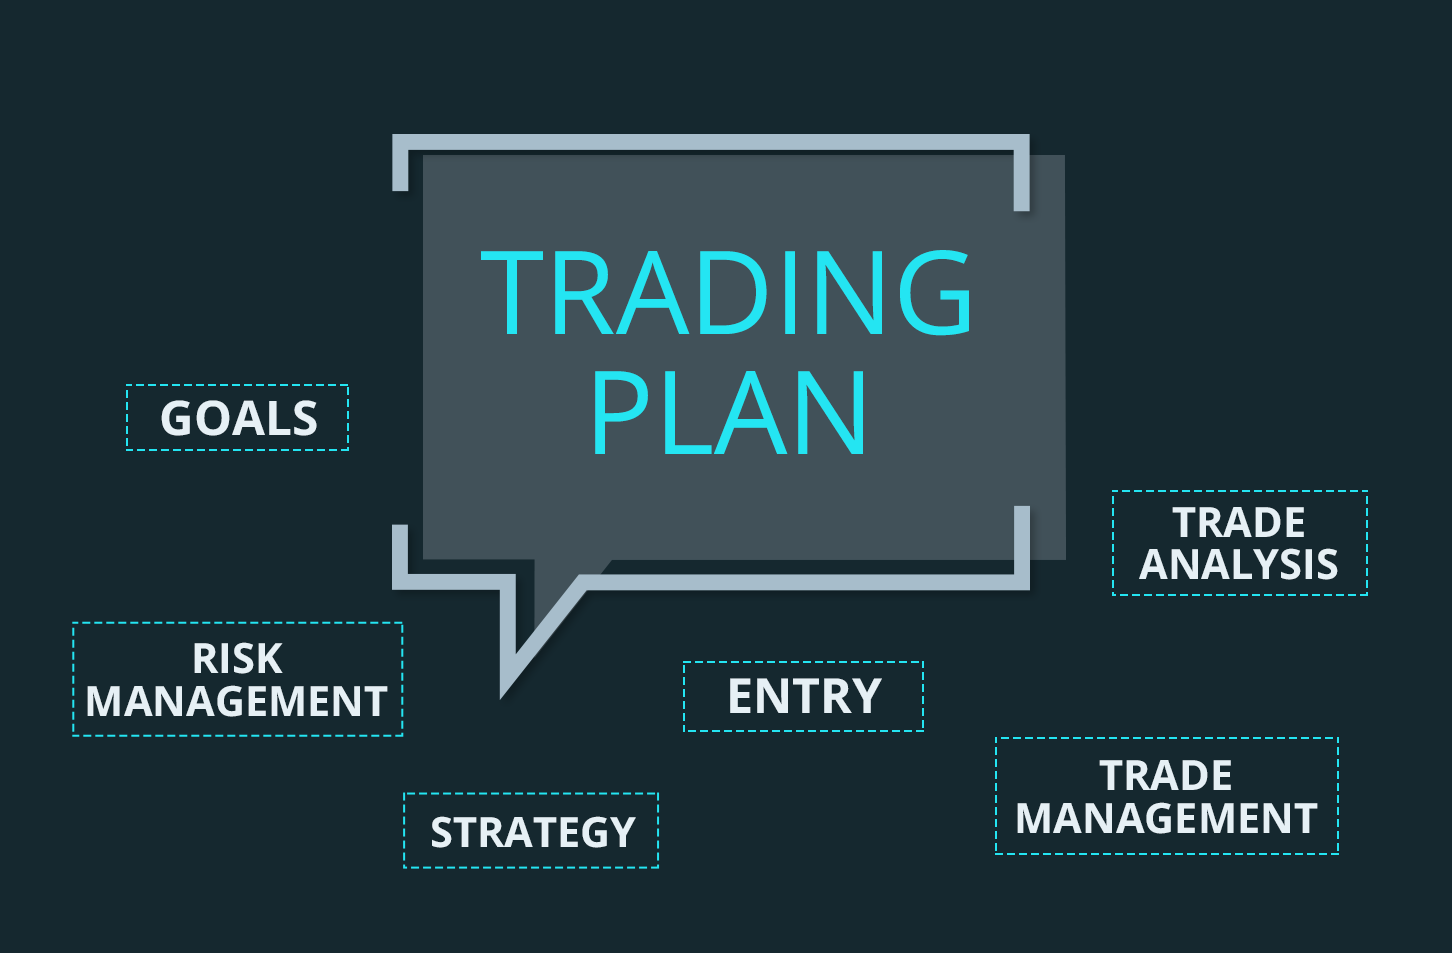
To protect themselves from anxiety and frustration when the entry into the market doesn’t work out, traders came up with the concept of a trading strategy or trading plan – a checklist to keep at hand before entering a trade:

The plan is somewhat similar to traffic lights:
- When the entry into the market is possible, it, conventionally, lights up green (lets you open a trade)
- When it’s not the best time to enter the market, it won’t allow you to spend money in vain
Yes, that’s the nature of technical analysis – it’s imprecise. And it does not provide any guarantees. But something has to, right? Of course, we will never reach 100% accuracy, but we can at least try.
For this, we have a fundamental analysis:
Fundamental Analysis for Beginners
Analyzing candlesticks and zones on the chart is good, but in trading, we want to deal with some real data and facts. Let’s talk about the three most popular metrics that novice traders should know:
Gross Domestic Product (GDP)
To get a bigger picture of what’s going on with the currency, we should look at the country’s GDP.
Perhaps, you already came across this term at high school or university. So, you may remember that GDP stands for the gross domestic product. In simple words, GDP is the total value of all goods and services a country has produced.
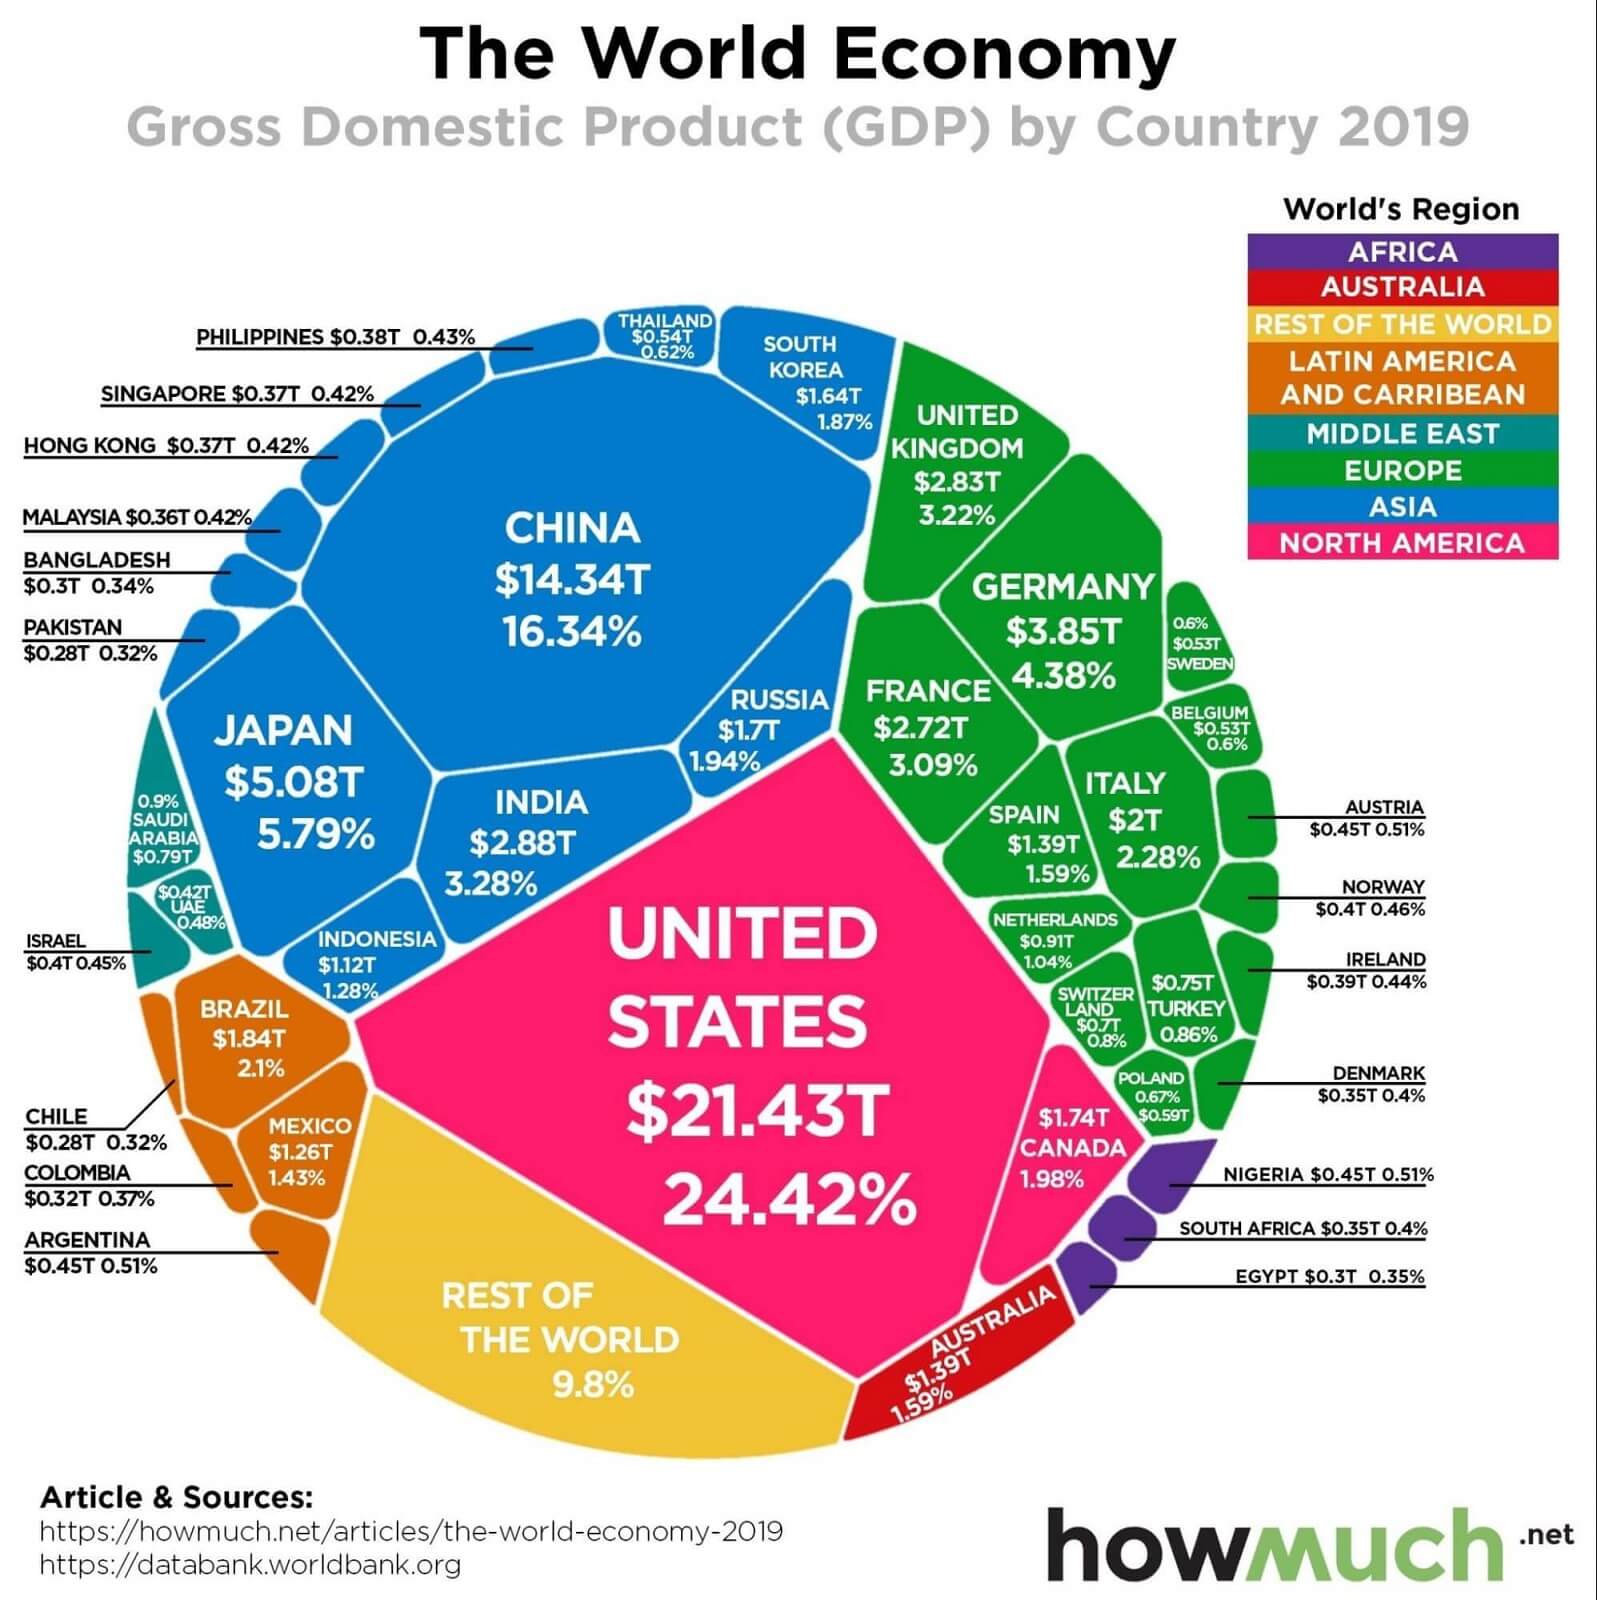
GDP by country 2019
This value is usually expressed as a percentage and is recalculated quarterly. If the indicator grows, the country’s currency may strengthen. If GDP falls, the country’s currency is likely to sink.
Unemployment
Not a very optimistic term, right? Why couldn’t market analysts just use “employment level”? It sounds a tad more encouraging.
Unemployment is a key indicator of economic growth. And, as you understand, the country’s national currency. The lower the unemployment rate, the more people produce goods and services. The GDP is rising (and hence, our currency).
We can safely derive a rule from this principle:
A strong economy equals a strong currency. A weak economy means a weak currency.
Interest rate
Central banks (CB) and governments attempt to manage the exchange rates of their national currencies and prevent radical currency fluctuations.
To do this, they employ their most powerful tool, the interest rate:
The interest rate is like a lever the Central Bank pulls when necessary to push the economy along the desired trajectory.
The interest rate works according to the following principle. The central bank is the main lender for commercial banks (the ones that issue your cards, approve your mortgages and loans).
Every night our main lender (CB) charges local banks a small percentage.
Now, look how it all works. Commercial banks grant loans to the general public and businesses, but at the same time, they themselves take loans from the central bank.
When the Central Bank raises the rate, loans become more expensive for commercial banks. For businesses and the general public, the interest rate becomes higher too.
This is how the Central Bank regulates the cash flow in the country:
- Low interest rate enables people to get more loans and borrow more money.
- High interest rate, on the contrary, makes us tighten our belts.
It’s better to take out a loan at 0.1% than at 5%, right?
Bonus: Market Sentiment
Now, let’s speak about a metric that shows:
- how many traders are betting on the currency to rise
- how many are betting on it to fall
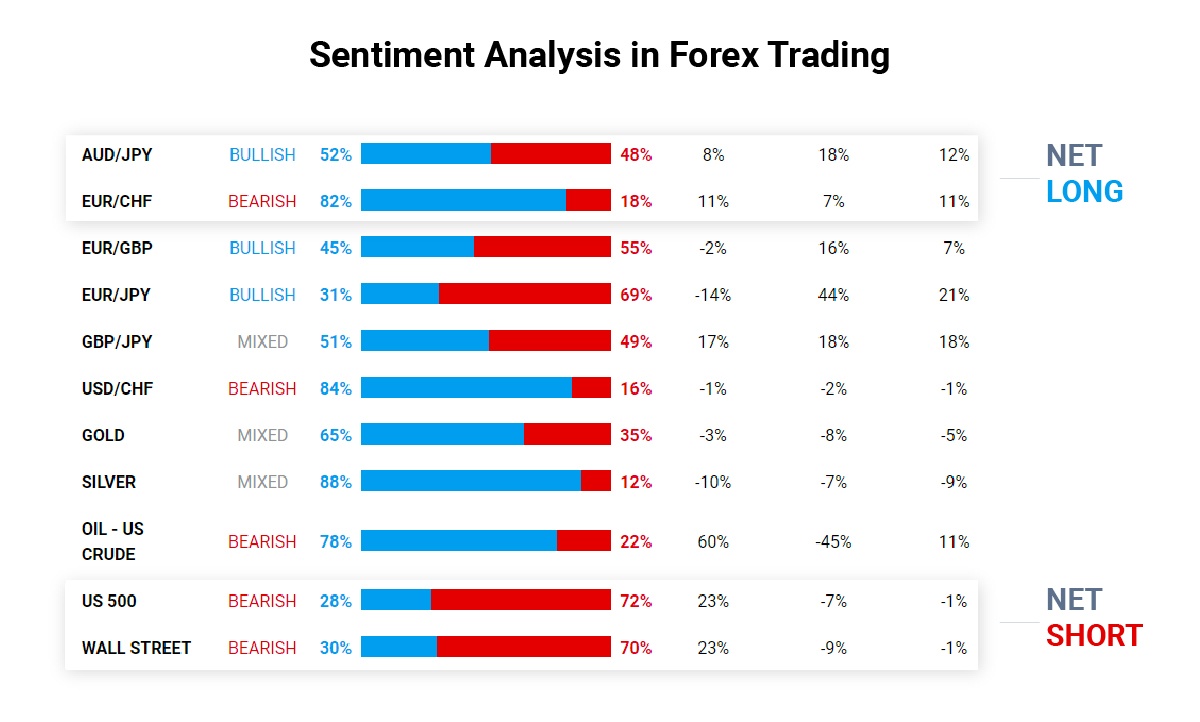
This metric is called “market sentiment”, or the sentiment of market participants.
There is only one problem with it – it is inaccurate (like everything else in the trading world). Each exchange, broker and fund will have different numbers.
It’s all about the nature of the foreign exchange market – it’s decentralized or over-the-counter. There is no one physical location where traders go to buy or sell currencies. Banks, traders and funds trade through electronic communication networks (ECN).
Therefore, there is no single source or system to draw data from. So, dear newbies, treat the “market sentiment” as an additional signal – not the main one.
Inaccurate fundamental analysis
As you may have guessed, fundamental analysis, like technical analysis, can not provide you with a 100% accurate signal to buy or sell.
When a significant economic release or positive news comes out, it sometimes happens that the price falls for some reason. Yes, it’s quite the opposite outcome. And we would like to share one of such stories with you:
How fundamentalists sold Tesla
In 2017, just before the release of the Tesla Model 3, Tesla shares were growing by leaps and bounds:
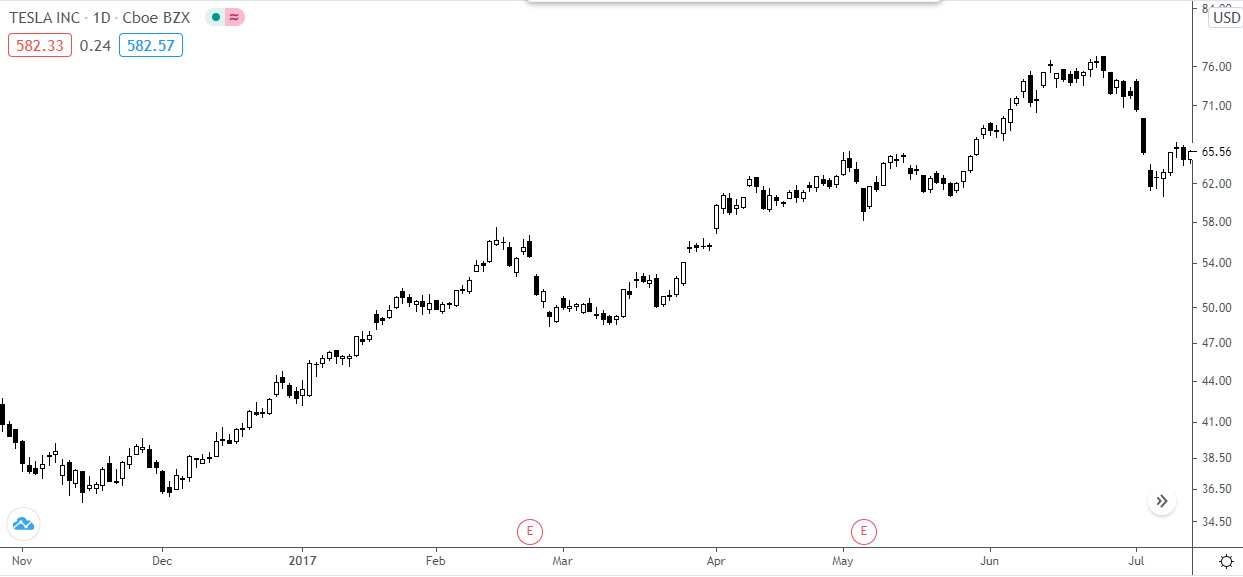
Investors believed that Tesla’s new electric car would be cool and really hype. And, as you can see on the chart, they invested quite a bit of money in stocks of this company.
At that time, an information massacre was raging around Tesla. Analysts unanimously shouted that the company had:
- No funds on its balance sheet
- Recorded another unprofitable quarter
- Had terrible debts
In some ways, they were right: Tesla did struggle with the shortage of funds and net debt. And traders understood this but kept investing their money in the company in the long-run, “for the future”.

Who won in the end (see the chart above)? Price. It always gets the last word:
“I don’t know whether I make myself plain, but I never lose my temper over the stock market. I never argue with the tape. Getting sore at the market doesn’t get you anywhere.”
— Said Jesse Livermore, one of the most shrewd traders of the 20th century.
From his quote, we can draw one main conclusion:
You can’t blindly believe fundamental indicators.
We won’t try to persuade you that economic metrics are always accurate. Using them in your trading can work out for you or not.
Therefore, the best long-term strategy, like 5 centuries ago, is the combination of both technical and fundamental analysis. Combine both types of analyzes and the accuracy of your predictions will increase dramatically.
Also, there is another approach that will help you earn more: focus on one or two assets. Which ones? Let’s figure it out now:
Currency Pairs for FX Newbies

All currencies fall into 3 categories:
- Majors or major currency pairs
- Minors, or cross currency pairs/crosses
- And exotic currencies
Major currency pairs
The major currency pairs or the majors always include the US dollar:
- EUR/USD, euro or eurodollar
- GBP/USD, pound
- USD/CHF, franc
- USD/JPY, yen
- USD/CAD, Canadian dollar
- NZD/USD, New Zealand dollar
- AUD/USD, Australian dollar
Majors are the most liquid and reliable pairs. It’s better to start your trading with these pairs.
Minors
They’re cross currency pairs or crosses. Why crosses? Because they do not involve the US dollar.
If you want to exchange one of those currencies, you first need to convert it into U.S dollars and then convert it into the desired currency. These are the pairs:
- GBP/JPY
- EUR/GBP
- CAD/JPY
- AUD/CAD
And others.
Minors are slightly more difficult to trade: their liquidity is lower than that of the majors.
Exotic currencies, by the way, are the most difficult to trade:
- EUR/TRY
- USD/SEK
- USD/NOK
- USD/DKK
- USD/ZAR
The easiest and most difficult pair to trade for novice traders
We often hear that the eurodollar is the easiest pair to trade. This is a myth: trading EUR/USD at the start of your trading career can be pretty challenging:
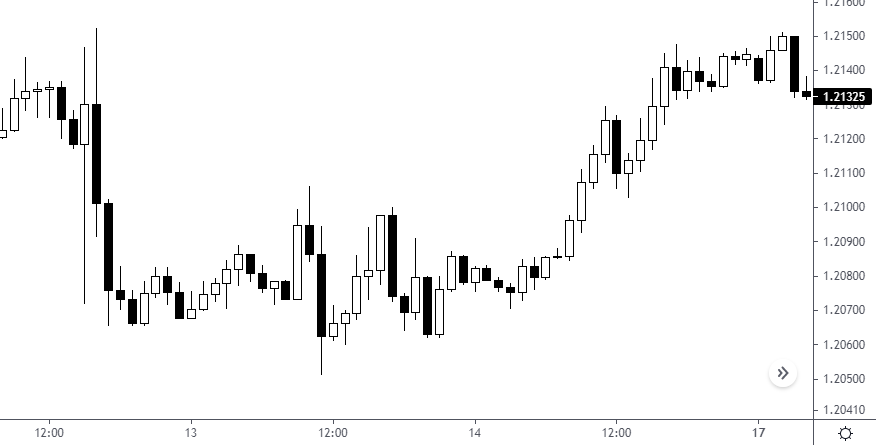
EUR/USD during a news release
The eurodollar is influenced by dozens of micro- and macro-economic indicators we’ve mentioned above:
- The European Central Bank’s (ECB) interest rate
- Unemployment
- Eurozone GDP
- US Federal Reserve Bank’s interest rate
As well as geopolitical events. Geopolitics is an integral part of trading. In the long term, the fate of governments and their currencies depends on it.
If you want to trade EUR/USD, you should closely watch the rhetoric of major European policymakers, especially statements made by the ECB president – Christine Lagarde. It can be very useful in your trading.
The easiest currency pair
Okay, “What is the easiest currency pair to trade?”, you may ask.
The answer is: the easiest pair to trade is the one that you know best.
Ask yourself a question:
Which country is closest to me?
Maybe Japan? Or Australia with its kangaroos, koalas and AUD/USD?
There are two countries behind every currency pair. Two central banks. Two presidents.
Each country has its own GDP, unemployment rate and key interest rate, which always fluctuate. We think you get the point.
And remember: a country does not always need an expensive currency. A high currency value often interferes with development. That’s why the Central Bank can artificially lower it. Keep this in mind.
How to start making money in the foreign exchange market – the first steps
You have now transitioned from a newbie who makes rookie mistakes due to the lack of knowledge to a person who understands the basic principles of trading. It’s right about time to make some money:
Select a platform to monitor prices
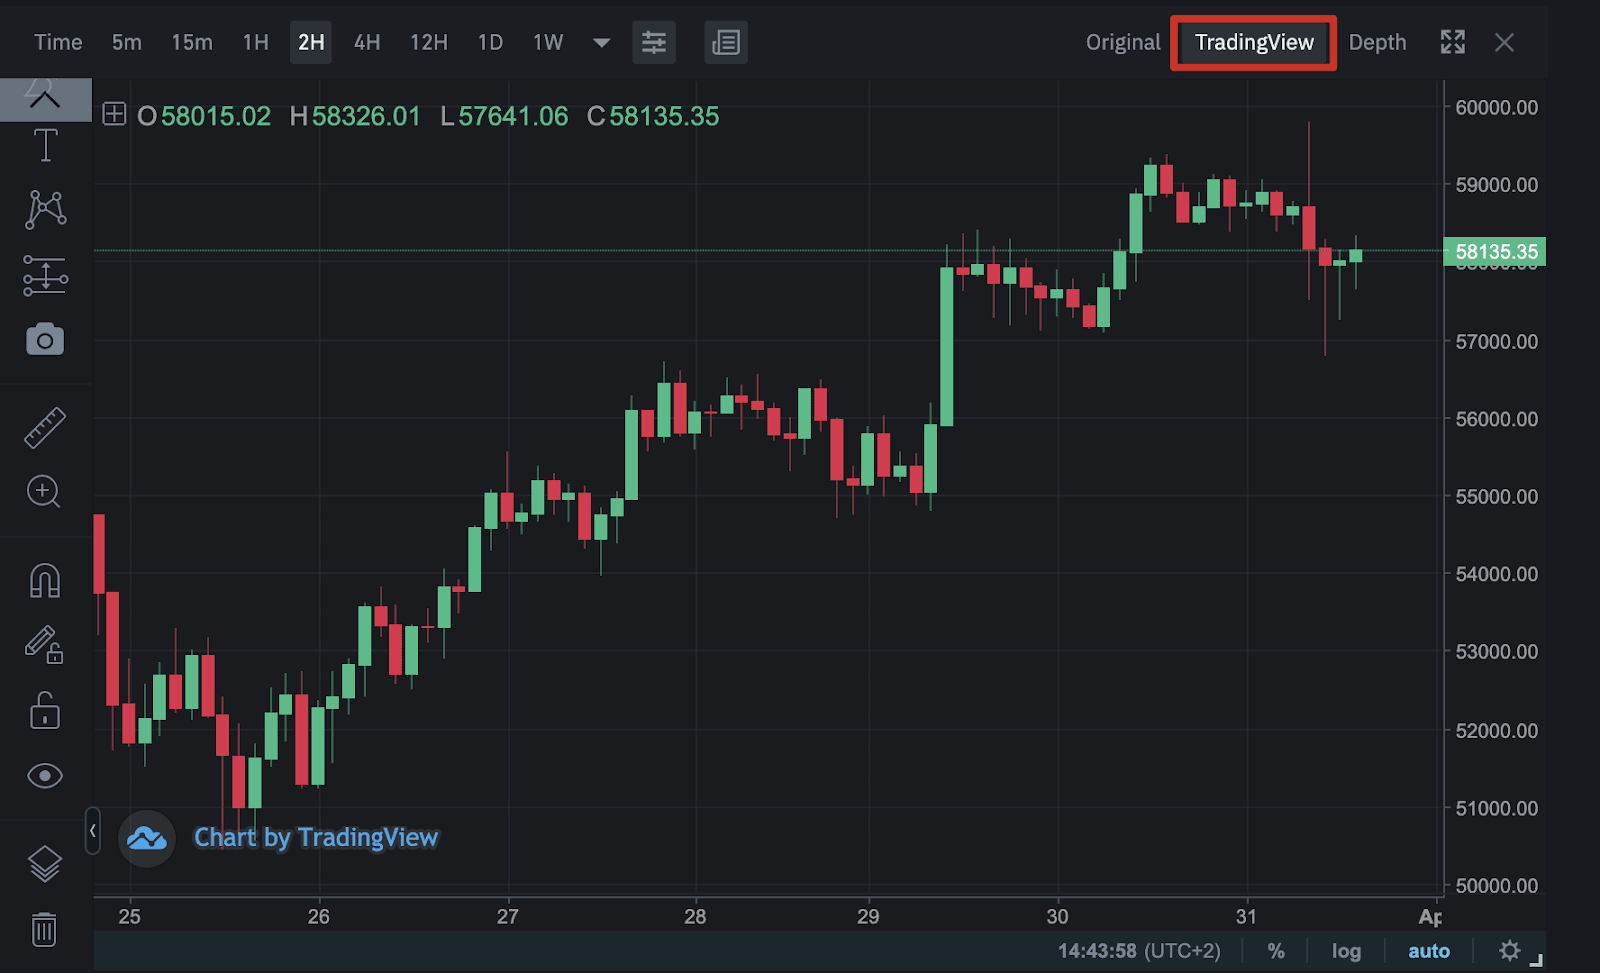
Most traders look up the prices in TradingView, but they trade in MetaTrader 4 or 5.
- TradingView is a platform that allows you to view quotes. And it’s free.
- MetaTrader 4/5 is a trading platform where you can perform trading transactions. Also free.
There are almost no differences between the MetaTrader 4 and MetaTrader 5 versions of the platform, so for now, you can download MetaTrader 4. You will need it later.
Decide on a trading strategy
We have already got acquainted with the basic trading tools – technical and fundamental analysis.
We have TradingView to watch the prices and the MetaTrader platform to trade. Excellent.
All we need now is to choose a trading strategy for beginners and start making money.
Steps to follow to build a winning trading strategy
Everyone creates a trading strategy as they see fit. For example, you like Japanese candlesticks and you want to use them to earn money. Excellent!
You need to:
- Understand how chart patterns work. To do this, we recommend reading “Candlesticks: Graphical Analysis of Financial Markets” and “Beyond Japanese Candlesticks” by Steve Neeson.
- Learn how to spot patterns on the chart;
- Understand when the chart pattern will work and when it gives false signals;
- Write out the criteria in your notebook, Google Keep, Notion or another note-taking app.
And enter a trade only if all these criteria are met.
Sounds too easy, right? There must be some catch here.
The problem is that many people lack self-discipline: they will trade everything with no system whatsoever. And they end up losing money.
Don’t be like them. Do now only enhance your understanding of charts and patterns. Improve your self-discipline too:
Discipline in trading

In fact, discipline is the #1 most important skill. Being organized and doing everything according to plan is a trait that will help you not only to become a better trader. It’s the key to achieving personal goals and career success in general.
Everything in the world is built on money, fame and discipline. Therefore, it’s essential that you check out another one of our articles – How to Develop Self-Discipline: 5 quotes from Trading Gurus that have made millions in the market. And you know, those quotes are pretty inspiring.
Sports and trading
No, you don’t have to go jogging in the morning to become a trader. We just want to tell you one story.
In the early 2000s, Wall Street was actively recruiting athletes. The bankers believed that since athletes know how to achieve goals in sports (motivation and discipline), they might succeed in trading as well.
And they were right – athletes did make fortunes. Many of them came from the Ivy League – world-class universities that considered athletics a huge part of campus life and paid special attention to sports.
Don’t get us wrong, we don’t want you to see that trading is a sport. Because it’s not. A trading process may be quite boring at times, like running in the morning without music. You need to learn a lot to become a professional. Self-discipline is one of the skills you need to master.
In the meantime, you already have a card up your sleeve – yourself. You can learn from your mistakes, adjust your approach, improve your discipline… It’s all up to you – everything is in your hands.
And we, like a happy ending for every good story, are ready to drive off into the sunset. But let’s summarize what we’ve learned from this article.
Key takeaways. Start small
As the ancient Chinese wisely said,
“The path of a thousand li begins with one step.”
Today we have completed all the levels of the game called “currency trading”:
Level 1: Why Everyone Loves Forex
It’s the world’s richest and most liquid market.
Technical and fundamental signals work best when trading Forex (these words don’t sound so scary anymore, huh?)
Level 2: Trading History
Traders used to trade rice. Back in the day, they had no charts at all. (!)
So, today we can say that we are lucky: we have TradingView, MetaTrader, ECN accounts and candlesticks plotted on the chart automatically.
Level 3: Skills Every Trader Needs To Be Successful
There are only two of them: technical and fundamental analysis. Okay, three. We did include self-discipline. You’ll need a lot of it if you plan to swim in the financial ocean with Wall Street’s sharks.
Level 4: Best Currencies To Trade
The majors, of course:
- EUR/USD
- GBP/USD
- USD/CHF
- USD/JPY
- USD/CAD
- NZD/USD
- AUD/USD
You can also consider EUR/GBP. It trades well in a flat market – we checked.
Boss Level: How to start earning with AMarkets
Congratulations! You have passed all the levels of a beginner trader!
To get into the real world of trading, you need to open an account with a reliable broker. How about the AMarkets global broker, trusted by 3,000,000 clients worldwide?
Fascinated by FX trading and its boundless opportunities? We thought as much. But remember: any type of investment carries risk. We’ve given you the tools and described how to use them. Now, everything is entirely up to you.
Before you start trading, we recommend that you consult with professional traders and investors.
We wish you good luck!
You can find more interesting articles in our blog! Don’t forget to subscribe to our social media: