Today, there are more than 19,000 cryptocurrencies in existence and counting. On the one hand, crypto trading opens up huge opportunities. On the other hand, such a wide variety can be overwhelming and confusing for a novice crypto trader. How to start trading cryptocurrencies? How to choose the best cryptocurrencies for trading? What crypto trading strategies are suitable for beginner traders? Read on to find out.
Article content
Cryptocurrency trading: where to start?
Let’s not delve too far into theory and move straight to the trading process. How to trade effectively? Analyze professional traders and try to repeat their actions and mimic them at first.
Professional traders can be divided into two categories:
- Technical analysis gurus. These professional traders make their trading decisions based on technical analysis – chart patterns, indicators, etc. They can place a trade in almost any cryptocurrency.
- Fundamental traders specializing in narrow crypto niches. These trading professionals study key trends of several crypto instruments and open trades mainly based on fundamental factors.
At its core, cryptocurrency trading for beginners is no different from professional trading. Both novice and seasoned traders buy and sell cryptocurrencies to make speculative income. The only difference is that professional traders earn more consistently.
How to trade cryptocurrencies: basic principles
The basics of crypto trading are no different from trading in traditional financial markets. A professional trader who works with major currency pairs like EUR/USD, GBP/USD, AUD/USD and etc., can quickly get the hang of the key cryptocurrency chart patterns. Below, we’ll consider a simple crypto trading algorithm, find out which cryptocurrencies are the best for trading, and take a look at effective trading strategies.
Choosing a timeframe
Which trading style do you prefer? Do you like holding your positions for a couple of days, or do you prefer scalping? In the first case, we recommend choosing M30, H1 and H4 timeframes. For scalping, it’s better to opt for M1, M5 and M15.
In this case, “M” stands for “minute,” and “H” stands for “hour.” Accordingly, “M15” means that each candle on the chart will take fifteen minutes to form.
Many novice traders wonder: “What is the best timeframe to trade cryptocurrency?” The answer is simple: “The one you are most comfortable working with.”
Depending on the screen size, it can fit an average of 350–450 candles. Therefore, if you open the H1 timeframe, you’ll be able to see the price action for the last 18 days. If you select an M1 timeframe – for the past 8 hours.
The larger the time frame you choose, the more accurate information you get when analyzing the chart.
Focus on particular cryptocurrencies
To get started, select a few crypto assets and study them thoroughly: Who created them and why? What is their average trading range for a particular period? What are the prospects for their use?
Even if you don’t plan to do thorough research on each cryptocurrency in the future, answering these questions will help you identify the main factors you need to consider when making your trading decisions.
Searching for the best patterns based on historical data
Use historical data to determine the most reliable chart patterns. You can do it manually or using automated software.
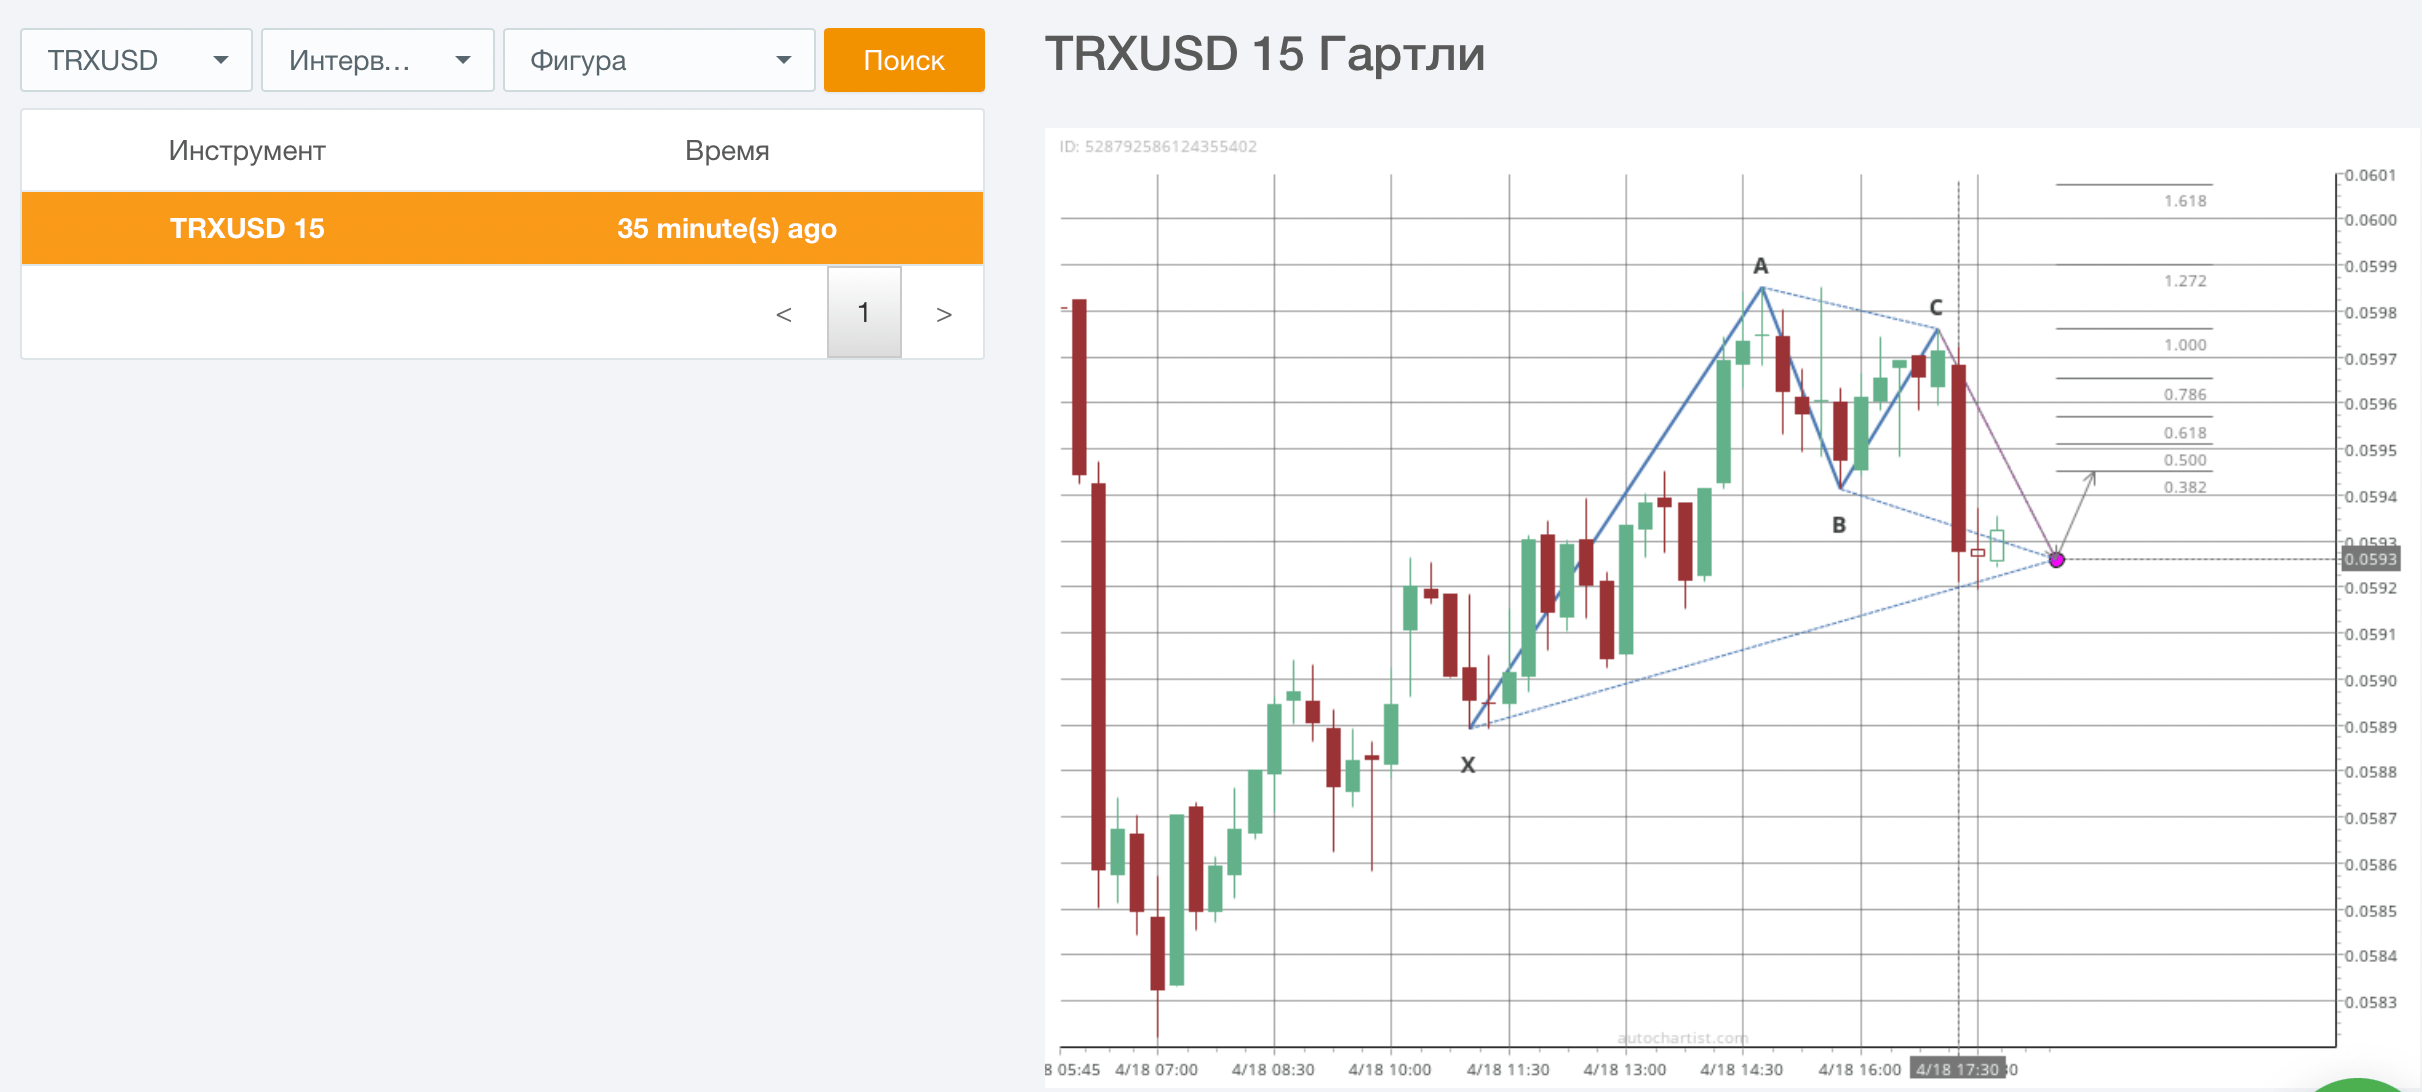
Autochartist software’s signals and TRX/CHF chart with Fibonacci targets for price growth, M15 timeframe. Date: 18.04.2022. Source: AMarkets Personal area. This information should not be construed as investment advice.
The chart above shows an example of a chart pattern generated using the AutoChartist automated software. The program analyzes dozens of trading instruments, identifies chart patterns and sends you signals and price alerts whenever a new opportunity presents itself.
The chart shows a complex Gartley butterfly pattern consisting of several waves. It signals a subsequent price increase.
To get free access to AutoChartist trading signals, simply:
- go to your AMarkets Personal area
- in the “Services” section, click on the “Trading Signals” icon
Get ready-made technical analysis signals and make money with the Autochartist service.
Testing patterns on real-time data
Find these patterns in real-time and make a profit. Traders who mainly use technical analysis believe that history repeats itself.
So, if you’ve already backtested specific technical indicators and chart patterns on historical data and made sure they can provide reliable trend reversal or continuation signals, start testing them in your live trading.
Not so sure about your trading strategy? Feel free to test it on a demo account in real-time with zero risk.
Register a demo account now and get $10,000 in virtual funds!
Best cryptocurrencies to trade
Here are the top 5 trading cryptocurrencies you can trade right now.
- Bitcoin (BTC/USD). The popularity of DeFi projects, the development of the NFT infrastructure, the adoption of bitcoin as legal tender in El Salvador, the launch of the first Bitcoin ETF on the New York Stock Exchange – all these events should ensure a significant increase in the BTC rate in 2022.
- Ethereum (ETH/USD). As of April 19, 2022, Ethereum is the second-largest cryptocurrency by market capitalization ($375 billion) after Bitcoin.
Experts believe that Ethereum is one of the most promising cryptocurrencies in the long term. Unlike Bitcoin, Ethereum is intended to be much more than simply a medium of exchange or a store of value. You can also deposit, invest and earn interest on Ethereum.
- Ripple (XRP/USD) was created to improve the speed and efficiency of interbank transactions using blockchain technology. The XRP rate is rising due to an increase in the number of unique addresses, the implementation of new products, and the periodic redemption of tokens by the company itself.
- Stellar (XLM/USD) is aimed at simplifying cross-border payments. Cross-border payments on the Stellar Blockchain platform eliminate intermediaries from the payment system and allow users to transact directly. Technically, the cost of one token is now relatively low: to record a new all-time high, Stellar has to rise by 270%, while bitcoin only needs to grow by 65%.
- Cardano (ADA/USD) is one of the most promising assets in the DeFi sector. The Ethiopian government even decided to use Cardano blockchain technology to modernize its national education system. In addition, Cardano aims to facilitate banking, financial services and healthcare globally.
Earn in financial markets today! Follow daily updated trading ideas on the website and in Telegram and become richer every day!
Patterns in cryptocurrency trading
Before we proceed to the description of chart patterns, let’s consider a fundamental concept that many novice traders often overlook: the correlation between trading instruments.
Correlation between cryptocurrencies
Correlation measures the degree to which two cryptocurrencies move in relation to each other. The correlation coefficient has a value that must fall between -1.0 and +1.0. A high positive correlation signals that the assets move in the same direction and have a similar pattern.
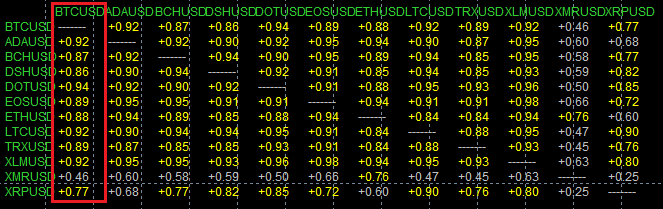
Correlation between cryptocurrency quotes based on 300 H4 candles. MetaTrader 4 trading terminal. Date: 18.04.2022.
In the figure above, the red box highlights the correlation between BTC/USD and other cryptocurrency pairs. 10 out of 12 cryptocurrency pairs positively correlate with Bitcoin by at least 87%, which indicates that these cryptocurrencies are greatly affected by the BTC/USD dynamics.
A similar correlation is observed between Brent and WTI oil, which are almost a single asset. In other words, a high positive correlation between crypto assets indicates their interdependence.
Since the top cryptocurrencies are very closely correlated with Bitcoin, experts analyze the BTC/USD price action first when making their projections.
Fibonacci in cryptocurrency trading
Let’s look at one of the most popular and very effective tools used in cryptocurrency trading – Fibonacci Retracement levels.
Fibonacci retracements can be used to place entry orders, determine stop-loss levels, or set price targets. Fibonacci retracement levels are support and resistance levels that are based on the Fibonacci numbers. Those are 23.6%, 38.2%, 61.8% and 78.6%.
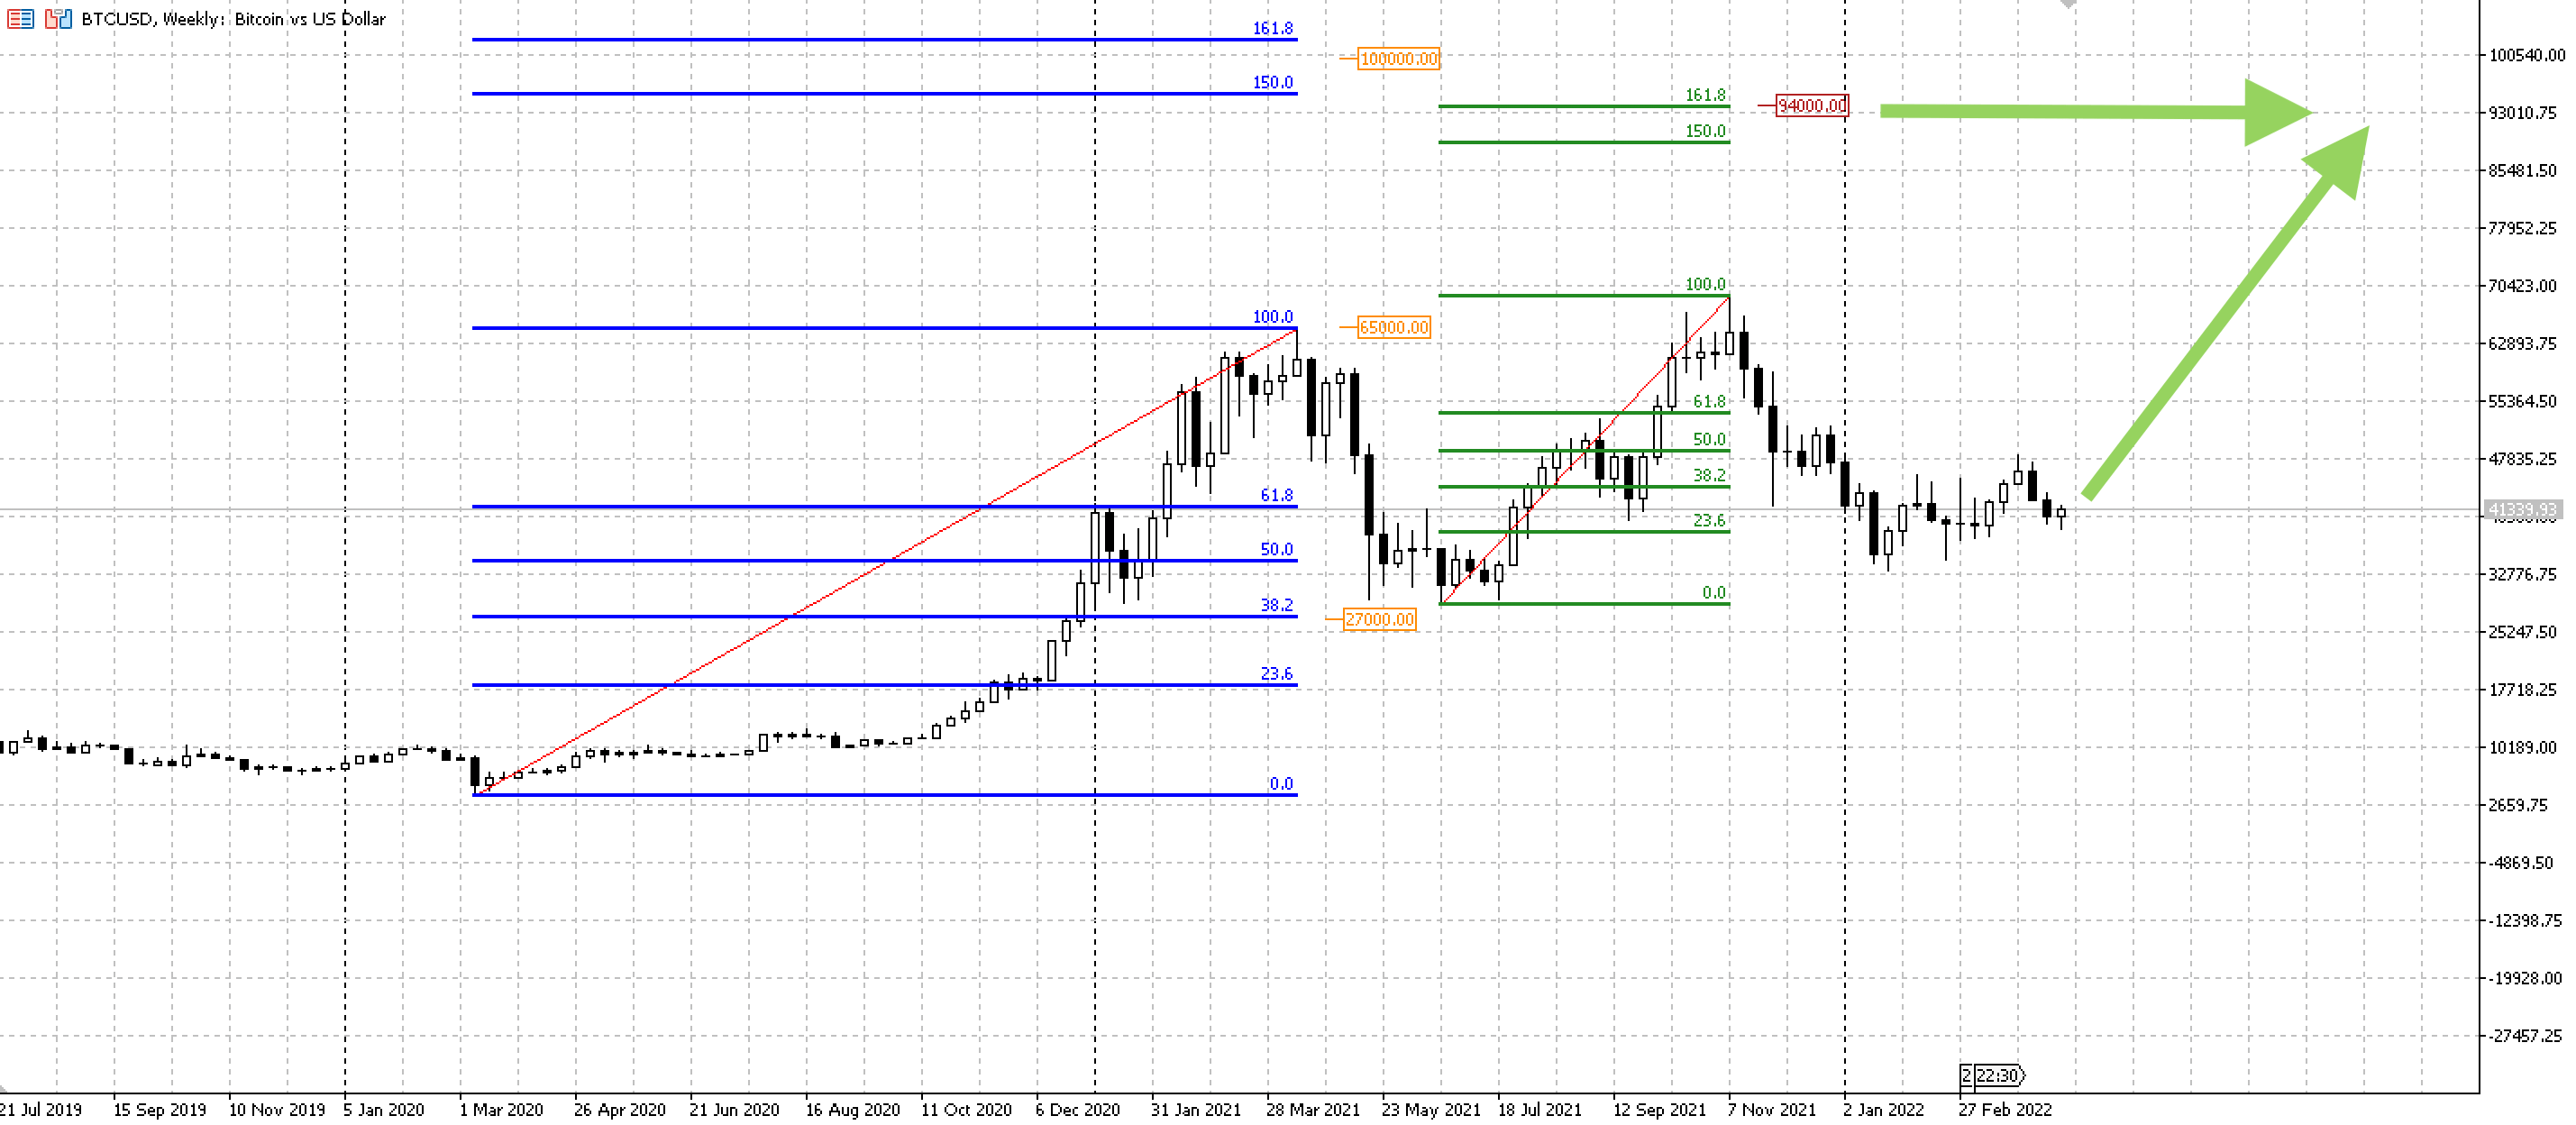
BTC/USD chart from July 21, 2019 to April 19, 2022, MetaTrader 5 trading terminal, W1 candles. Date: April 19, 2022. Quotes provided by the AMarkets online broker. This information should not be construed as investment advice.
In the BTC/USD chart above, you can see an example of using Fibonacci levels.
- The blue grid marks the levels during bitcoin growth from the end of 2020 to April 2021.
- The green grid – from June to November 2021.
The blue grid quite accurately predicted the depth of correction: the 38.2% level at $27,000, where the BTC/USD price fell later.
Why do experts say Bitcoin could hit $100,000?
On the one hand, this is a round number, and markets like round levels. Psychological levels are often key levels denoted by round numbers.
On the other hand, $100,000 is located near the 150% and 161.8% levels of the blue grid. To be more precise, it’s the $94,000 level (marked by green arrows) that is located at the intersection of the above-mentioned levels. So, we believe that it’s a more accurate target than the round $100,000 mark.
Why are Fibonacci tools so effective? Because most cryptocurrencies don’t have a long trading history. Traders need an approximate target to calculate the risk/reward ratio and build their trading strategies. That’s why many of them use Fibonacci grids.
Cryptocurrency Trading Platforms
A cryptocurrency trading platform is a unique program that allows the user to open, modify, and close transactions to purchase and sell crypto-currency within special instruments.
For example, to open a trade on Litecoin (LTC/USD), you need to open an account and connect to the trading platform. Next, you need to select the desired cryptocurrency in this platform, analyze the quotes chart, and decide on the deal.
Platforms are different: universal and highly specialized. The latter is created based on specific brokers and exchanges and has a narrowly focused functionality of work within the framework of the presented trading instruments. The first ones allow you to work with almost any asset, regardless of the exchange and broker.
It is much easier to get acquainted with the platform once and use it in various markets than to constantly “relearn”: memorize the functionality of new platforms and get used to their interfaces.
One such universal platform is MetaTrader 5, one of the most widely used trading terminals in the world. Use the benefits of MetaTrader 5 to earn money:
- market and pending orders of six types;
- extended Depth of Market;
- possibility of hedging open positions;
- free indicators and trading advisors;
- built-in economic calendar and market news update in real-time;
- trading in a mobile application and browser.
Try all the features of MetaTrader 5 for cryptocurrency trading on
an AMarkets demo account! You will receive $10,000 in virtual funds and access to live quotes. Test strategies and trading ideas without risk!
Effective cryptocurrency trading strategies
Although you can profit both from a downward and upward market, the essence of cryptocurrency trading is to find assets that have good upside potential. In a way, investing in cryptocurrencies is similar to investing in stocks.
Let’s consider two strategies.
Strategy #1. Following bitcoin
From July to October 2021, bitcoin surged by 135%. Polkadot (DOT/USD) cryptocurrency showed a 440% growth over the same time period. In the following months, both assets retraced to their July values.
This example suggests that if BTC/USD rises by 160% to $100,000 as early as 2022, then DOT/USD could skyrocket by about 550% to $115.00 over the same period.
It’s worth noting that these cryptocurrencies differ in value. In other words, for $1,000, you can buy about 0.026 BTC or 57.6 DOT (as of 25.04.2022) – 2215 times more.
Other cryptocurrencies such as Solana (SOL/USD) and Dashcoin (DSH/USD) can generate a similar “increased” revenue.
Strategy #2. Trading chart patterns
The cryptocurrency market is relatively young, and cryptocurrencies haven’t fully formed their trading ranges just yet. Therefore, traders and investors need some signals and indicators that can help them spot the right time to enter and exit the market.
Many crypto traders use classic chart patterns and technical indicators to trade cryptocurrency.
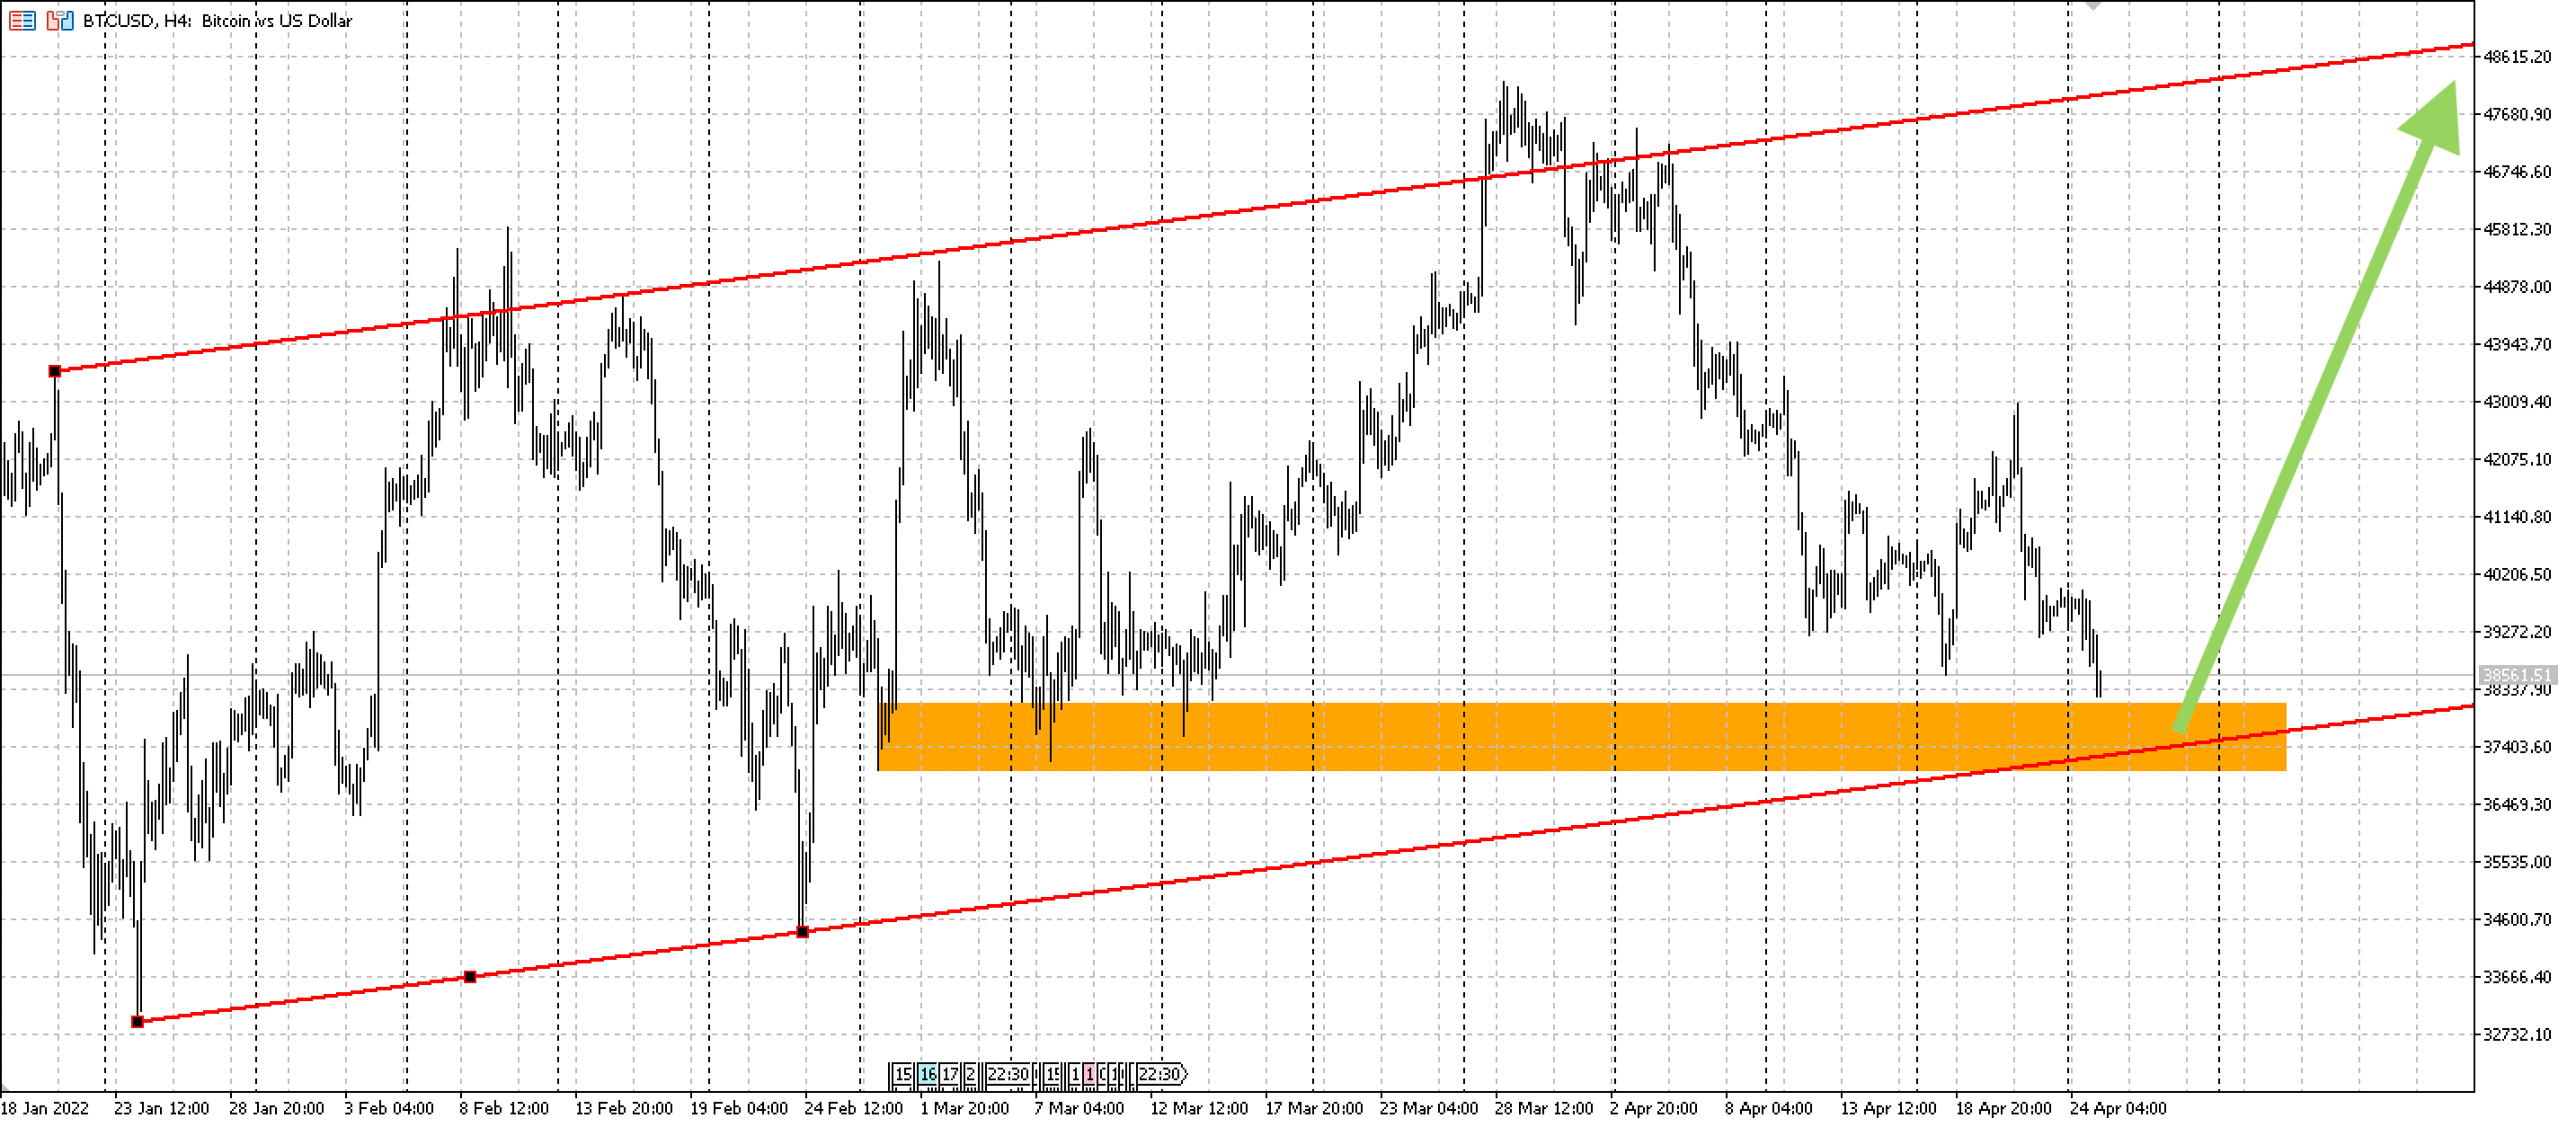
Bitcoin (BTC/USD) chart. Period: January 18, 2022 to April 25, 2022, MetaTrader 5 trading terminal, H4 candles. Date: April 25, 2022 Quotes are provided by the AMarkets online broker. This information should not be construed as investment advice.
The chart above shows the changes in the cost of one bitcoin in US dollars. The red lines on the chart compose a price channel, where the BTC/USD rate has been oscillating for the last three months, rebounding quite strongly from the channel’s borders: more than 95% of the price action took place inside the channel.
The orange line represents the local support level formed earlier due to price accumulation: $37,000–$38,100. If the price keeps moving within the given range, we can expect a rebound from this support level with targets of $48,000 and higher.
This analysis is a great example of how even simple chart patterns can be easily and successfully applied to cryptocurrencies.
All in all, the blockchain industry is still very young. There are multiple crypto sectors to choose from. New cryptocurrencies keep emerging, and some of these altcoins may explode in the future. Cryptocurrency trading offers vast trading opportunities. Any beginner trader who is just getting started can choose a narrow niche for himself and become a crypto professional.