Price action is the same as technical analysis, it uses fewer tools. Price action traders use:
- candles
- trends
- zones
- and indicators
Article content
There are thousands of such tools and various strategies that use these tools in technical analysis. Price action supporters said, “We’ll pick the best ones and make real money. There’s no time to play with technical analysis and its tools. Time is money”. So, let’s find out if they succeeded:
- First, we’ll reveal 2 price action secrets
- Then, we will build our first “structure”
- And finally, we will find that “Coolest Candle”.
Ready? Then let’s get down to business:
Price Action: Secret #1
Price action traders don’t like indicators.
Yes, sometimes we can see moving averages, Stochastic and Bollinger bands on price action charts. Price action followers plot them to identify the trend and buy/sell zones. They consider indicators as a secondary, assistive instrument, nothing more. Price action traders do not trade using indicators as some beginners do.
Price Action: Secret # 2
A price action trading is always well-structured and is carried out according to a certain scenario. It means that:
- There is a clear trend
- There is a supply/demand zone nearby
- The right candlestick has appeared on the chart
Sometimes one of the components of this structure is missing. Nothing wrong with that: instead, there will be a moving average or two setups in a row. The most important thing is to gather as many signals as possible in one place. That’s how the price action gurus understand that the trade is worthy.
Price action: What does it look like?
It’s actually very simple:
Trend, zone, candlesticks: that’s pretty much it. There’s nothing fancy here.
But there are thousands of examples of various success stories on the Internet. We found ours on the web too.
Such trades make their holders rich, and it’s time for us to start learning. Inhale, exhale … Let’s do this:
How to trade Price Action
We found out that price action is based on a combination of the three structural components, all gathered in one place:
- We need a trend – the direction of the price
- We need a zone: a place where the price reversed earlier
- You can’t do without special candles – setups. In price action, they are similar to candlestick combinations used in technical analysis. They are fairly easy to spot.
Now, let’s build a “structure”
First of all, let’s focus and find the necessary price action conditions on the chart:
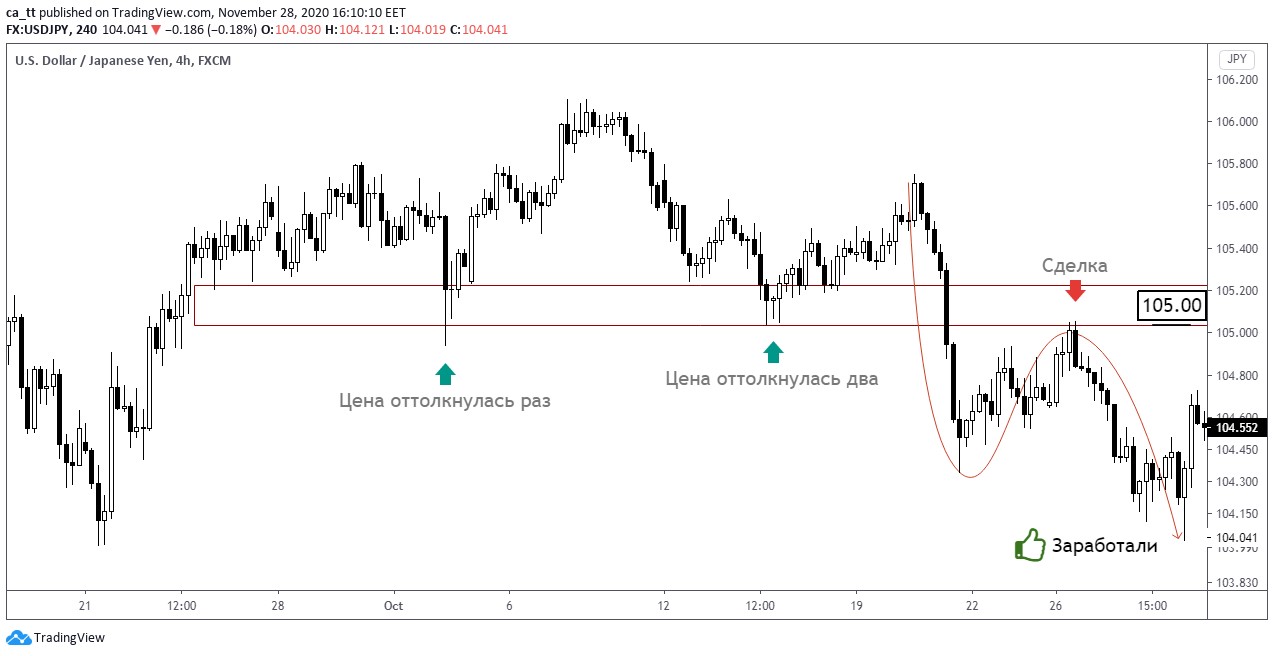
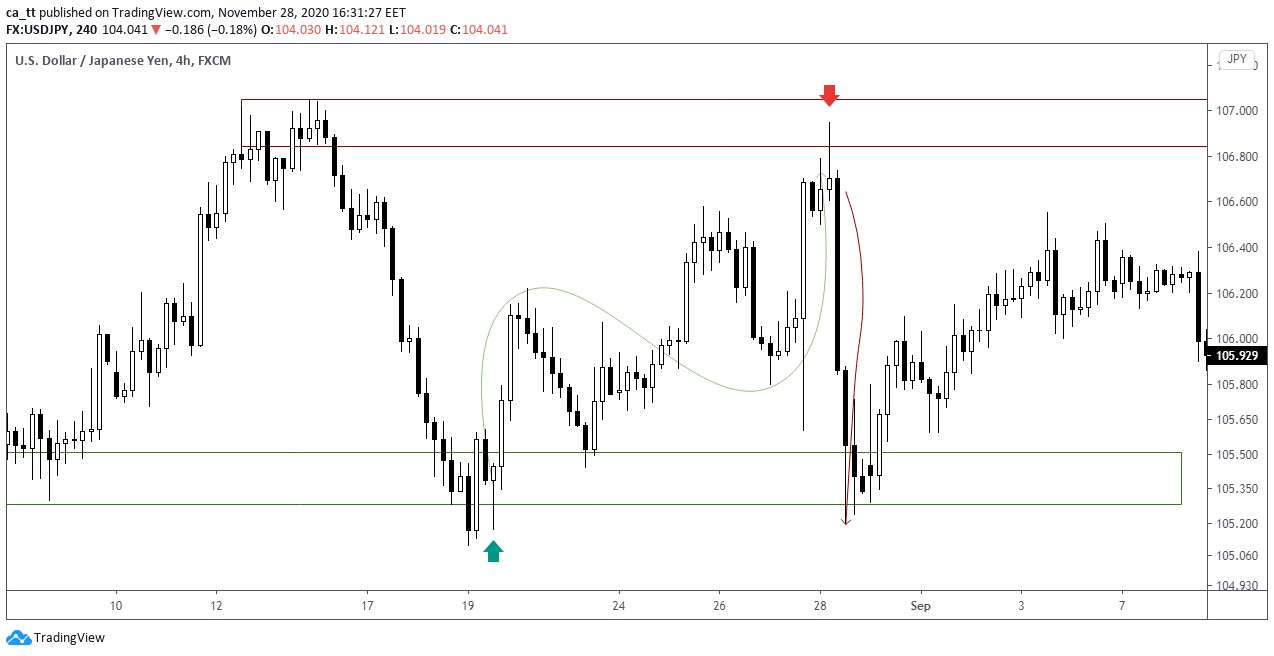
So what we see on the chart:
- Red zone, which kept the price from falling 2 times
- Then the price broke the zone with large candles
- Before the breakout, the price demonstrated a sideways trend, and after the breakout, the downtrend commenced
- The price fell below the zone and then pulled back to the breakout point. And then it continued its way down.
Have we found all the signals? Almost.
There were obvious clues on the chart that the price was about to go down. For example, the round level 105.00.
Also, the engulfing candlestick pattern, marked with a red arrow. So, we have found as many as one, two, three … five hints for a reversal. And not a single indicator. Price Action traders would be proud of us now!
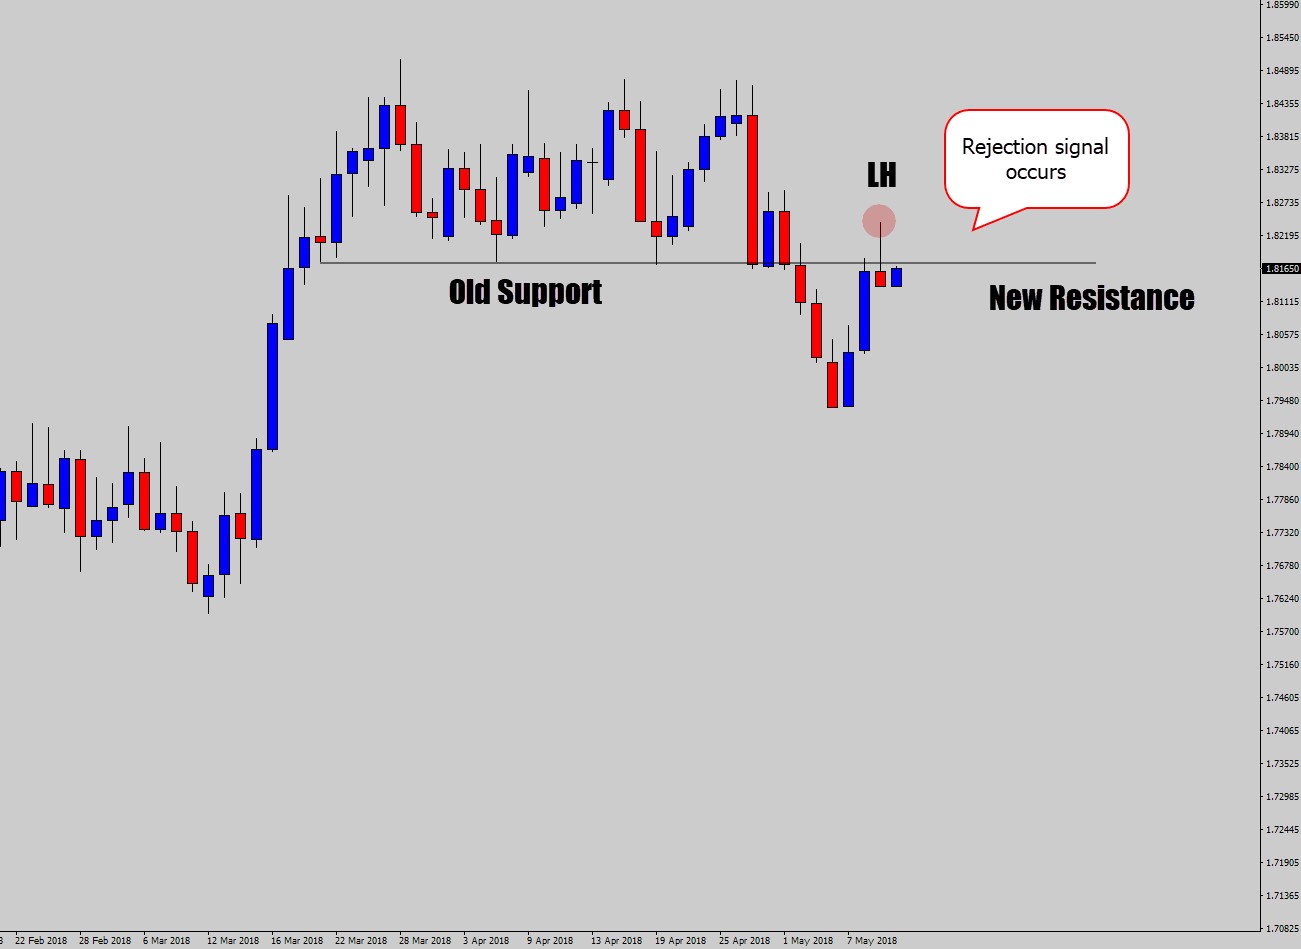
Price Action’s Top Secret: The Coolest Candle
From the very beginning of this article, we sought to figure out what that very same price action Candle, which would give us 100% of profitable trades, looks like. Sorry to upset you, but it’s not there. And it never was.
The good news is that there are still candles in the price action that work well. For example, the candles in the picture below. Make a screenshot of it, so that your deposit grows 50% next month. The money is drawn here, we are serious:

The candles under the arrows are called pin bars. The name comes from the original term “Pinocchio Bar”, a Pinocchio candle. Remember the tale of the wooden puppet-boy whose nose grew longer every time he told lies? Let us explain:
The candle has a shadow. A wick, a nose – call it as you may:
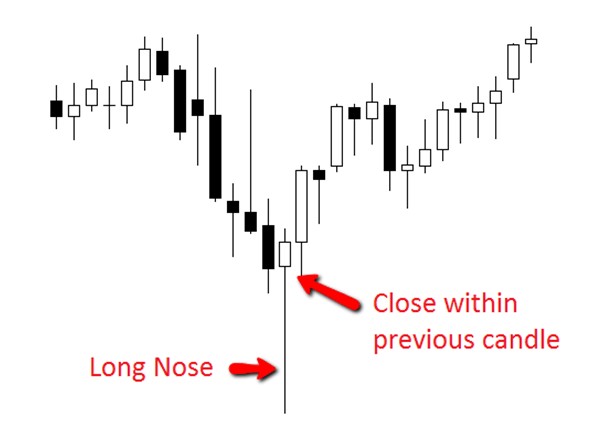
In the example, the shadow is a long wick at the bottom. It points to a number of things:
- To the zone that does not let “Pinocchio” into the reversal zone
- Round levels that are so prone to making the price reverse
- The speed at which the price refuses to go into the supply/demand zone.
When you look at it, a pin bar is itself a set of combinations. And he works perfectly. Check out the trends that pin bars are setting:
Believe us, these candles are savvy in money-making. So watch them closely.
Learn to trade them along with zones, trends and other price action components, and you will start earning 20-30-40% per month. It’s a pretty good deal taking that a savings account at the bank offers you 5% a year, isn’t it?
So don’t waste your time. Your home assignment is to find 10 pin bars on the chart. Look for the pin bars near the zone, along the trend, and near the round levels. It’s as easy as that!
We are always happy to get feedback from you. Feel free to share your thoughts and leave your comments.
See you next time!
If you like our articles, follow us on Facebook and Instagram. Stay tuned for more interesting posts on our blog. We post new material several times a week.